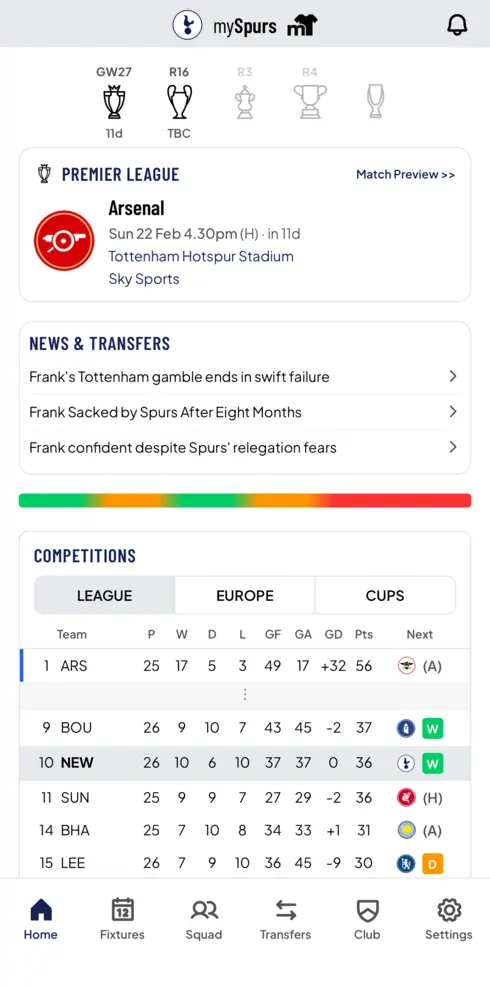
Track your club's stats and results in the myTeam app
Live scores, fixtures, and analysis every matchweek.
The Premier League Blockbuster Index
Which 25/26 Premier League teams are the most entertaining to watch? Based on match data, we've assessed how fun a club's games are to watch, and how much variety they bring to the buffet table.
Data correct as of
Variety (X axis)
How many different ways does this team play? Measures the diversity of their goals, passing, tactics, squad rotation, and pressing style — teams that do a bit of everything score higher than one-trick ponies.
Fun for Neutrals (Y axis)
How entertaining are this team's matches for a neutral viewer? Captures goal volume, comebacks, shots on target, late drama, and xG overperformance — the stuff that makes you glad you tuned in.
Data Table
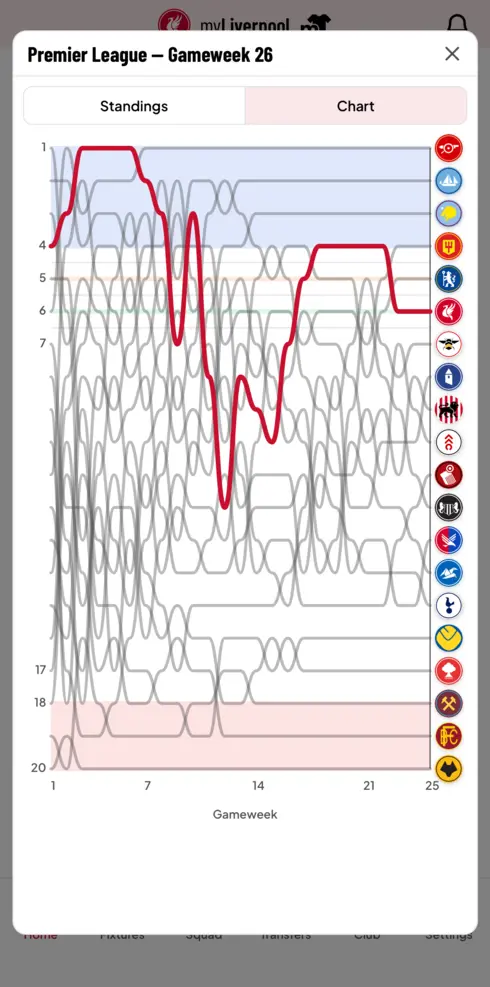
How to read this chart
- Each club badge represents a team's position across two composite scores.
- X axis (Variety): measures how diverse a team's playing style is -- goal types, pass mix, scorer spread, lineup rotation.
- Y axis (Fun for Neutrals): measures how entertaining matches are for neutral viewers -- goals, comebacks, drama, xG overperformance.
- Hover or tap a badge to see the full metric breakdown. Adjust the weights below to change what matters most to you.
Methodology
- While this is based on real match data and genuine statistical methods, this is a fundamentally unserious analysis. Please do not @ us.
- Data from SportMonks (events, stats) and TheSportsDB (xG, goals prevented). Updated weekly.
- Each sub-metric is min-max normalised across all 20 teams (0 = lowest, 1 = highest).
- Composite scores are weighted averages of normalised sub-metrics. Default: equal weights.
- Dashed crosshairs show the median values, dividing teams into four quadrants.
Track your club's stats, fixtures and more in the myTeam app