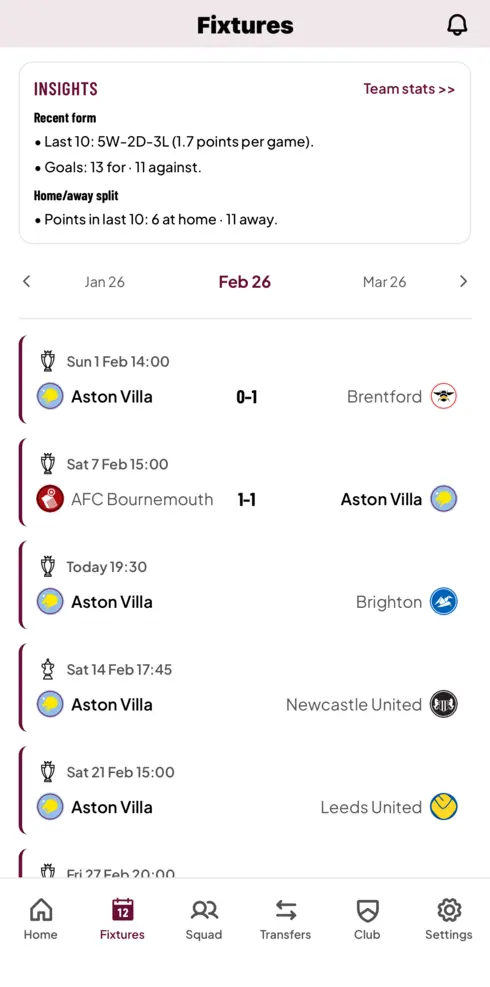
Track how the season unfolds in the myTeam app
Live standings, fixtures, and scores all season long.
Season Forecast
Where will each team finish? We simulate 50,000 possible seasons using Elo ratings that update after every match, Poisson goal models, and Club Elo tilt.
Data correct as of
12 gameweeks remain
Likely Possible Unlikely
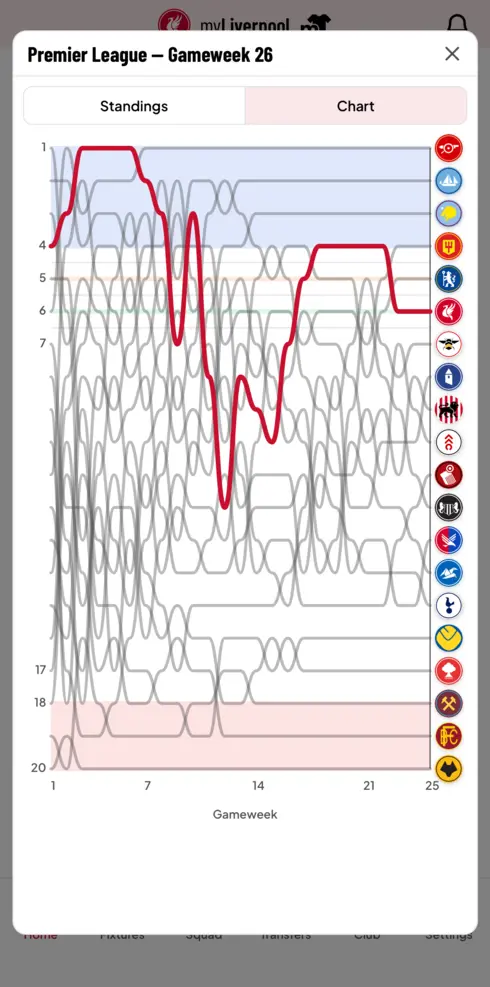
How to read this chart
- Each row is a Premier League club, sorted by predicted finishing position.
- Each column is a league position (1st to 20th). The number in each cell is the probability (%) that team finishes in that position.
- Darker cells mean higher probability. Hover or tap for exact figures.
- Zone backgrounds mark Champions League (1st-4th), Europa League (5th), and relegation (18th-20th) places.
Methodology
- We run 50,000 Monte Carlo simulations of the remaining 12 gameweeks (110 fixtures).
- Each simulation uses "hot" Elo ratings — after every simulated match, both teams' Elo ratings update based on the result and margin. This means a team on a winning streak gets stronger within that simulation, just like real momentum.
- Match scores are sampled from a Poisson distribution. Expected goals for each team are derived from the Elo difference plus Club Elo tilt (a measure of how many goals a team's matches tend to produce).
- Elo updates are weighted by goal margin: a 3-0 win shifts ratings ~1.7× more than a 1-0 win (proportional to √margin).
- Teams are ranked using Premier League tiebreakers: points, then goal difference, then goals scored.
- Elo ratings from Club Elo. Standings from SportMonks. Updated weekly.
See also
- GW Table Possibilities → Every possible position after this weekend's fixtures.
- Run-In Tracker → Predict results for every remaining fixture and see the projected table.
- Why Club Elo? → We tested three models against 760 real matches. Here's what we found.
Track your club's stats, fixtures and more in the myTeam app